
Spending Insights Premium
See where your money actually went, and whether a Pocket's amount is still the right one.
Spending Insights is part of Premium.
Get PremiumIt sits at the top of Transactions; tap Spending Insights to open it, and tap again to fold it away.
Three ways to look at it
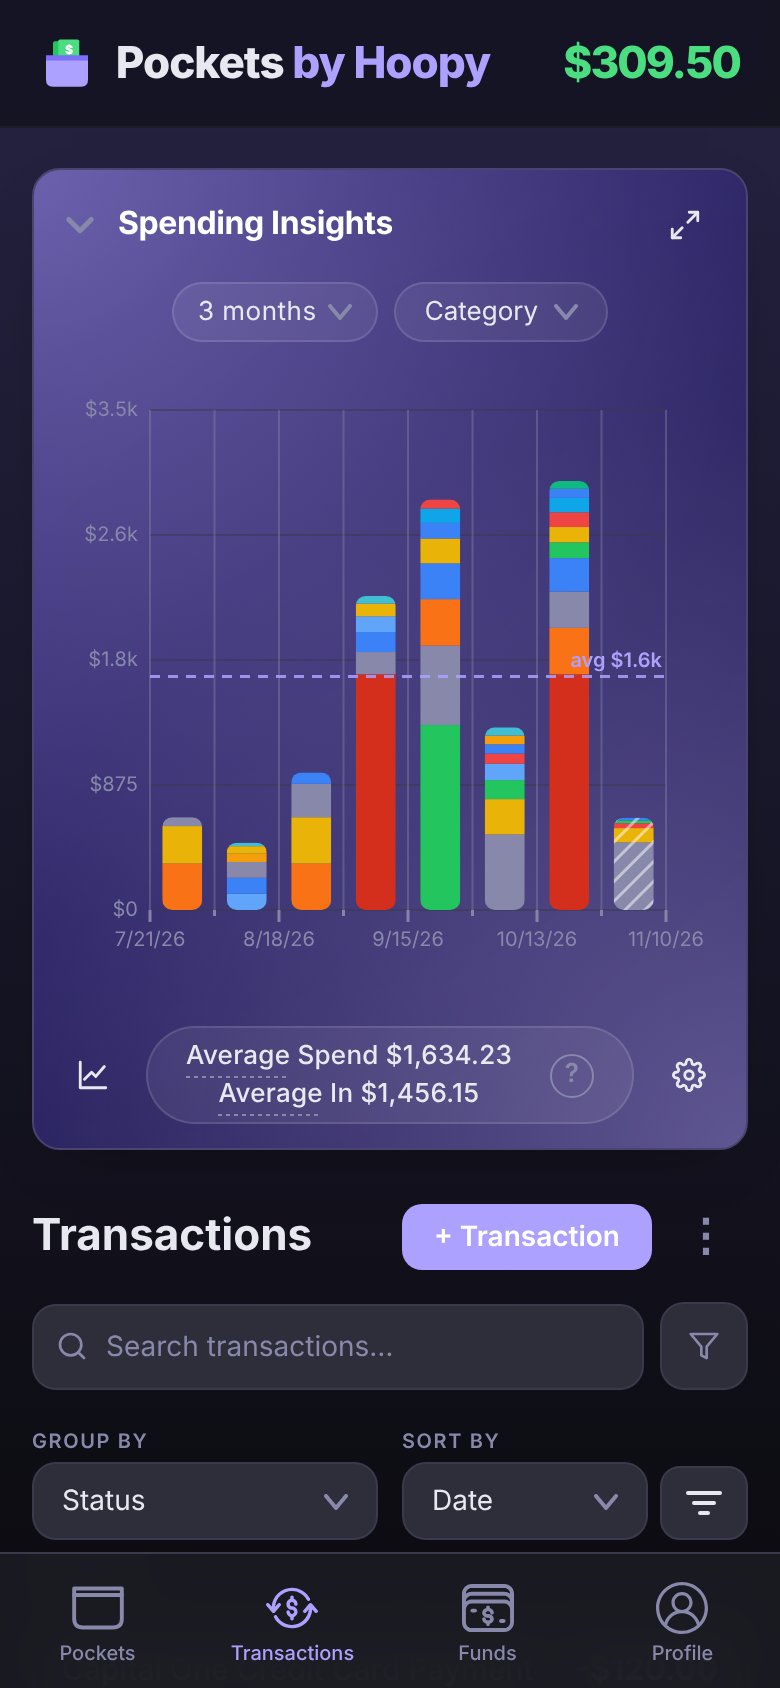
The button at the bottom left of the chart switches between three views, in turn:
- Donut: one slice per category, sized by what you spent. The middle shows the total.
- Bars: one bar per pay period, stacked by category, so you can see a heavy two weeks at a glance. The dashed line is your average. A striped bar is the pay period you're in now; it isn't finished, so it's left out of the totals and averages.
- Trend line: your spending per pay period as a line, to see whether it's climbing or settling.
The arrows at the top right open the chart full screen. On a computer, full screen shows all three at once.
Tap a slice to see one category
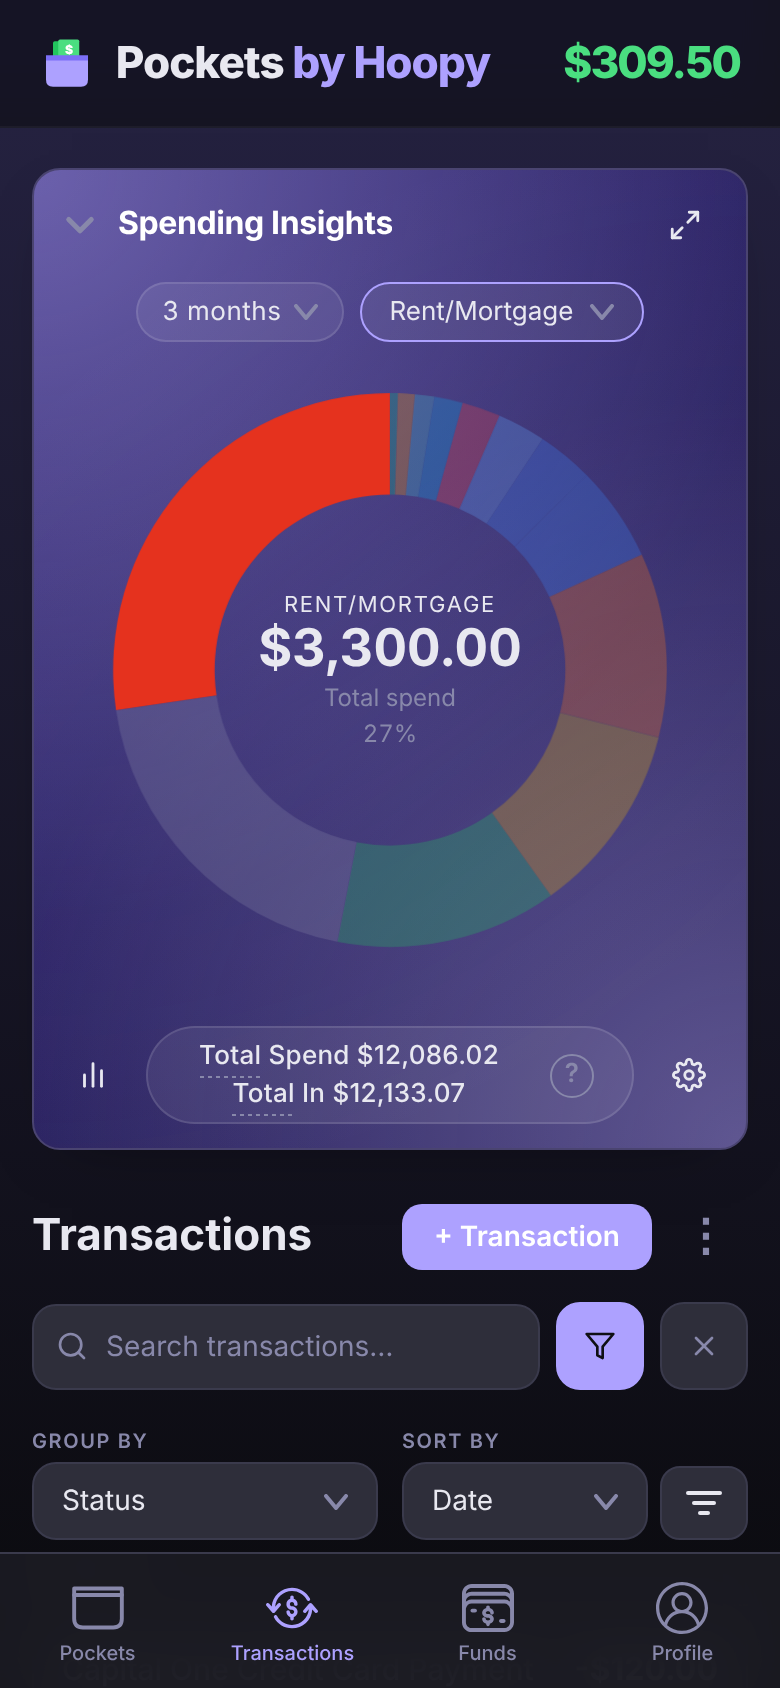
Tap a slice of the donut. The other slices dim, the middle shows that category's amount and its share of your spending, and the transaction list below narrows to that category. Tap the same slice again, or tap off the chart, to go back to everything.
Thin slices are hard to hit with a finger. The category menu at the top (it reads Category until you pick one) lists every category with its color, so you can pick one from there.
Total vs Average
Under the chart is a summary of the whole range, like Total Spend $11,439.61 · Total In $10,193.07. Tap Total or Average to switch between the two:
- Total is everything you spent, and everything that came in, over the range.
- Average is the same per pay period: Average Spend $1,634.23 is what a typical pay period costs you.
The donut starts on Total and the bars on Average, and each remembers your choice. With a slice selected, the middle of the donut follows the same switch. The ? at the end of the summary explains how the number is worked out.
Average is the one to check a Pocket against. If your Groceries Pocket gets $250.00 a paycheck but its slice averages $310.00, the Pocket is $60.00 short every time.
Choose the date range
Tap the range at the top of the chart, like 3 months, and pick 1 month, 3 months, 6 months, 1 year, 2 years or All time. Each option shows how many pay periods it covers, because the chart always counts whole pay periods; a range that started mid-paycheck would throw every average off.
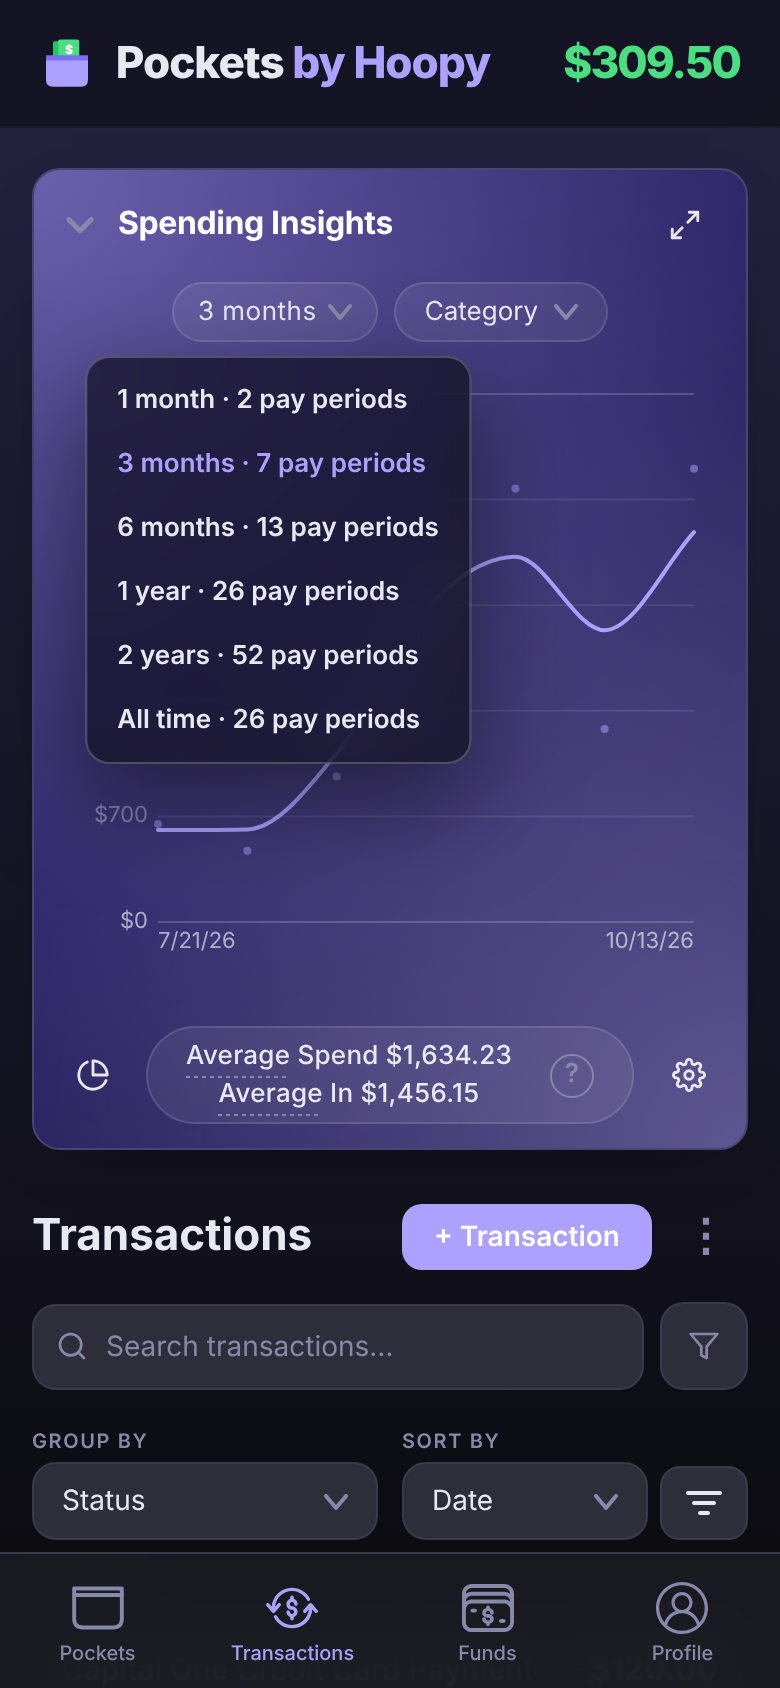
Chart options
The gear at the bottom right opens Chart options:
- Measure By: Pay Period or Month, for the bars, the line and every average.
- Include Transactions Not in Pockets: turn it off to chart only spending that came out of a Pocket.
- Show Transfers, Show Fees, Show Interest and Show Debt: bring those into the chart, or keep them out.
One Pocket at a time
On the Pockets screen, tap ⋮ on a Pocket and choose View Spending Insights to chart just that Pocket. There, the slices are merchants, so you can see that most of your Groceries money goes to one store.
Questions
Why doesn't the total include this week's spending?
The current pay period isn't over, so it's drawn striped and left out of the totals and averages. It counts once the next paycheck starts a new period.
How do I see something other than pay periods?
Open Chart options with the gear and set Measure By to Month.